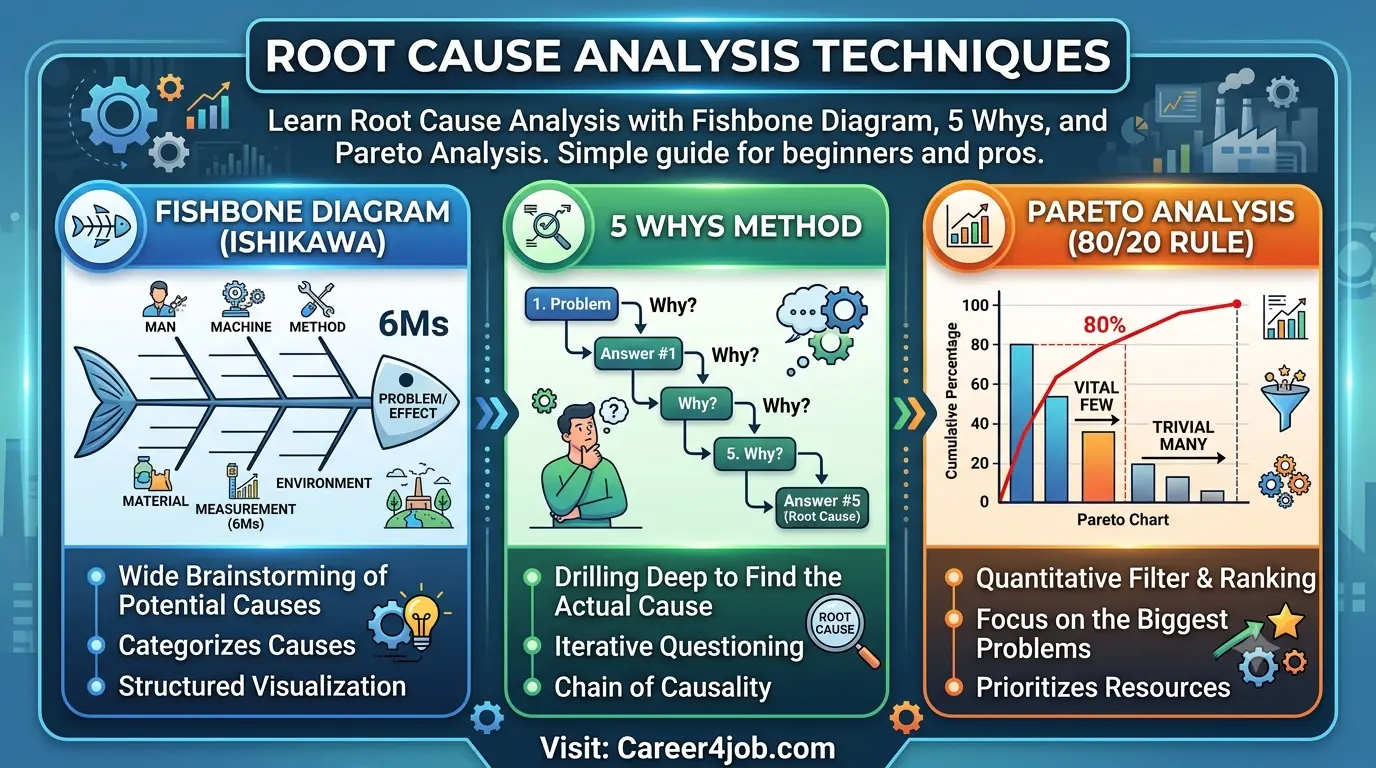
Learn Root Cause Analysis with Fishbone Diagram, 5 Whys, and Pareto Analysis. Simple guide with examples, steps, and tips for beginners and pros.
Introduction
Imagine a factory machine breaks down for the third time this month. Each time, workers fix it fast. Each time, it breaks again a few weeks later.
This is a common problem in many businesses. People fix the symptom, but not the real cause. The machine keeps failing because nobody asked, “Why does this keep happening?”
This is where Root Cause Analysis (RCA) helps. RCA is a simple but powerful way to find the real reason behind a problem. Instead of guessing, you follow clear steps to dig deep and find the true cause.
In this article, you will learn:
- What Root Cause Analysis means, in plain language
- Why it matters for businesses, students, and quality teams
- Three popular RCA tools: Fishbone Diagram, 5 Whys, and Pareto Analysis
- Real examples you can understand and use
- Common mistakes people make with RCA
- Best practices to get accurate results
By the end, you will know how to pick the right tool for your problem and use it with confidence.
| Quick Tip: You don’t need to be an engineer to use these tools. Anyone can learn them in a few minutes. |
What is Root Cause Analysis?
Root Cause Analysis (RCA) is a method used to find the main reason a problem happens. Instead of treating the surface issue, RCA helps you dig deeper to find the true source.
Think of a problem like a weed in a garden. If you only cut the top of the weed, it grows back. But if you pull out the root, it is gone for good. RCA works the same way. It helps you pull out the “root,” not just trim the top.
RCA is widely used in:
- Manufacturing and production
- Quality control and quality assurance
- Healthcare
- IT and software teams
- Customer service
- Safety and accident investigations
According to the American Society for Quality (ASQ), root cause analysis is “a collective term that describes a wide range of approaches, tools, and techniques used to uncover causes of problems” (source: asq.org).
Why is Root Cause Analysis Important?
Many teams fix problems quickly, without asking why the problem happened. This is called a quick fix or band-aid solution. It feels good in the short term. But the same problem often returns.
Root Cause Analysis is important because it helps teams:
- Stop problems from repeating
- Save time and money in the long run
- Improve product quality
- Reduce waste and downtime
- Build safer workplaces
- Make better decisions based on facts, not guesses
Without RCA, businesses fall into a cycle of repeated fixing. This wastes resources and frustrates teams. With RCA, you break that cycle for good.
Benefits of Root Cause Analysis
Here are the biggest benefits of using RCA in any organization:
- Prevents repeat problems – You fix the real issue, so it does not come back.
- Saves money – Fewer repeated failures mean lower repair and rework costs.
- Improves quality – Products and services get better over time.
- Builds trust – Customers trust businesses that solve problems properly.
- Boosts teamwork – RCA often involves group discussion, which improves communication.
- Supports continuous improvement – RCA fits well with Lean and Six Sigma methods.
- Reduces safety risks – Especially important in factories and hospitals.
| Why This Matters: A problem fixed at the surface can cost 10 times more if it returns later. Fixing the root cause the first time saves money and stress. |
Common Root Cause Analysis Techniques
There are many RCA tools. Some are simple. Some are more advanced. The three most popular and beginner-friendly tools are:
- Fishbone Diagram (also called Ishikawa Diagram or Cause-and-Effect Diagram)
- 5 Whys Method
- Pareto Analysis (80/20 Rule)
Other RCA tools include Fault Tree Analysis, Failure Mode and Effects Analysis (FMEA), and Scatter Diagrams. But this article focuses on the three most used and easiest to learn.
Let’s explore each one in detail.
Fishbone Diagram
What is a Fishbone Diagram?
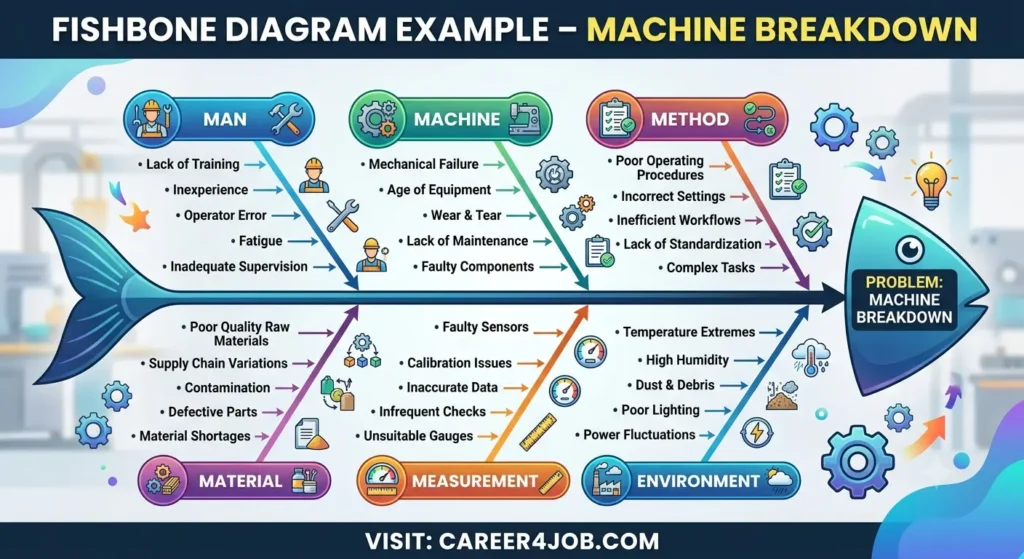
The Fishbone Diagram is a visual tool used to find all possible causes of a problem. It is shaped like a fish skeleton. The problem sits at the fish’s head, and the causes branch out like bones.
It is also called:
- Ishikawa Diagram (named after its creator)
- Cause-and-Effect Diagram
History of the Fishbone Diagram
The Fishbone Diagram was created by Dr. Kaoru Ishikawa, a Japanese quality expert, in the 1960s. He developed it to help teams at Kawasaki Shipyards find causes of manufacturing defects. Today, it is one of the seven basic quality tools recognized worldwide, including by ASQ (source: asq.org).
How the Fishbone Diagram Works
The diagram groups possible causes into categories. This helps teams brainstorm in an organized way instead of listing random ideas.
Common categories, known as the 6 Ms, include:
- Man (People) – human error, training, skill gaps
- Machine – equipment failure, poor maintenance
- Method – wrong process or procedure
- Material – poor quality raw materials
- Measurement – wrong or inaccurate data
- Mother Nature (Environment) – temperature, humidity, dust
You do not need to use all 6 categories. Choose the ones that fit your problem.
Steps to Create a Fishbone Diagram
- Write the problem at the head of the fish (right side).
- Draw the main spine – a straight horizontal line from the problem.
- Add category branches – draw diagonal lines for each cause category (Man, Machine, Method, etc.).
- Brainstorm causes – for each category, ask “what could cause this problem?”
- Add sub-causes – dig deeper into each cause with smaller branches.
- Review the diagram – identify the most likely root causes.
- Verify with data – confirm the real cause using facts, not guesses.
Practical Example
Problem: A machine breaks down often.
| Category | Possible Causes |
| Man | Operator not trained properly |
| Machine | Old parts, no lubrication |
| Method | No proper maintenance schedule |
| Material | Low-quality spare parts used |
| Measurement | No sensors to detect early wear |
| Environment | Too much dust in the work area |
After brainstorming, the team found that lack of a maintenance schedule was the biggest cause. They created a fixed maintenance plan, and breakdowns dropped sharply.
Advantages of the Fishbone Diagram
- Easy to understand, even for beginners
- Great for team brainstorming
- Organizes ideas visually
- Helps find multiple possible causes at once
- Works well for complex problems with many factors
Limitations of the Fishbone Diagram
- Can become messy with too many branches
- Does not rank causes by importance
- Needs a skilled facilitator to guide the session
- Does not confirm the root cause on its own; needs follow-up analysis
Best Use Cases for Fishbone Diagram
- Manufacturing defects
- Process failures
- Team brainstorming sessions
- Problems with many possible causes
5 Whys Method
What is the 5 Whys Method?
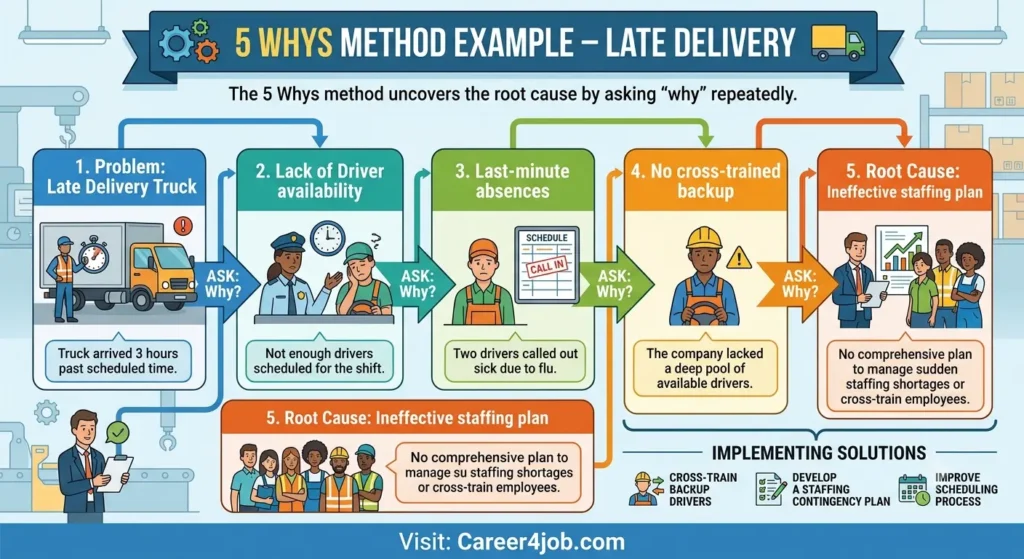
The 5 Whys Method is a simple technique where you ask “Why?” five times (or more) to get to the root cause of a problem. Each answer leads to the next question, like peeling layers of an onion.
It was developed by Sakichi Toyoda and later used widely at Toyota as part of the Toyota Production System. The Lean Enterprise Institute explains that 5 Whys helps teams “move beyond symptoms to understand the true root cause” (source: lean.org).
Steps for the 5 Whys Method
- Write down the exact problem.
- Ask “Why did this happen?” and write the answer.
- Ask “Why?” again, based on the previous answer.
- Repeat until you reach a cause that, if fixed, would prevent the problem.
- Usually 5 questions are enough, but you can ask more or fewer if needed.
Practical Example
Problem: The delivery truck arrived late.
- Why was the truck late? Because it left the warehouse late.
- Why did it leave late? Because loading took longer than planned.
- Why did loading take longer? Because the forklift was broken.
- Why was the forklift broken? Because it was not serviced on time.
- Why was it not serviced on time? Because there is no maintenance schedule for equipment.
Root Cause: No scheduled maintenance plan for equipment.
Solution: Create a fixed maintenance calendar for all equipment.
Notice how the first answer (“truck left late”) is just a symptom. The real cause was found only after asking “why” five times.
Advantages of the 5 Whys Method
- Very simple and quick
- Needs no special tools or training
- Works well for small to medium problems
- Encourages deep thinking
- Low cost to use
Limitations of the 5 Whys Method
- May lead to only one cause, missing other factors
- Answers depend on the knowledge of the team
- Can be biased if the team jumps to conclusions
- Not ideal for complex problems with many causes
Tips for Using 5 Whys Effectively
- Always base answers on facts, not opinions
- Involve people who understand the process well
- Don’t stop too early; keep asking until you reach a system-level cause
- Combine with Fishbone Diagram for complex problems
| Tip: If your answers feel like blame (“John made a mistake”), you have not reached the root cause yet. Keep asking why the system allowed that mistake to happen. |
Pareto Analysis
What is Pareto Analysis?
Pareto Analysis is a technique that helps you focus on the biggest problems first. It is based on the idea that a small number of causes create most of the problems.
The 80/20 Rule
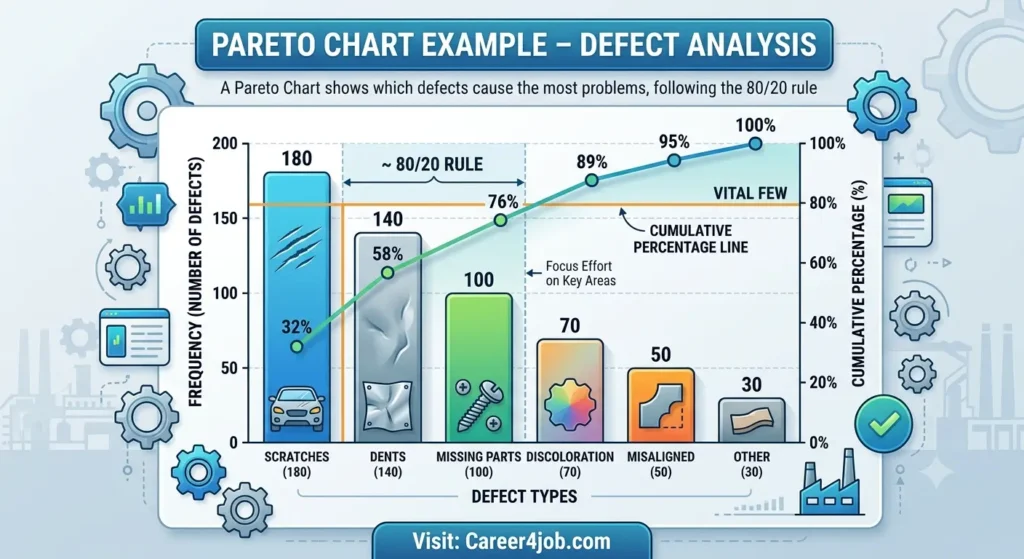
This is also called the 80/20 Rule or Pareto Principle. It says that about 80% of problems come from 20% of causes.
This idea comes from Italian economist Vilfredo Pareto, who noticed that 80% of Italy’s land was owned by 20% of people. Quality expert Joseph Juran later applied this idea to quality management.
Steps for Pareto Analysis
- List all problems or defects.
- Count how often each one happens.
- Sort them from highest to lowest frequency.
- Calculate the percentage of each problem out of the total.
- Create a bar chart with problems ranked from most to least frequent.
- Add a cumulative percentage line on the chart.
- Focus on the top 20% of causes that create 80% of the issues.
Practical Example
A factory records defect types over one month:
| Defect Type | Number of Cases | Percentage |
| Scratches | 120 | 40% |
| Wrong size | 90 | 30% |
| Color mismatch | 45 | 15% |
| Packaging damage | 30 | 10% |
| Missing labels | 15 | 5% |
Here, Scratches and Wrong size together make up 70% of all defects. Fixing these two issues first would have the biggest impact.
Advantages of Pareto Analysis
- Shows which problems to fix first
- Uses simple data and charts
- Saves time by focusing on high-impact issues
- Easy to present to management
- Works well with numeric or countable data
Limitations of Pareto Analysis
- Needs accurate data to work well
- Does not explain why the problem happens
- Not useful for one-time or rare problems
- Best used with other RCA tools, not alone
Fishbone vs 5 Whys vs Pareto
Comparison Table
| Feature | Fishbone Diagram | 5 Whys | Pareto Analysis |
| Best for | Complex problems, many causes | Simple, single-cause problems | Prioritizing multiple problems |
| Type of tool | Visual brainstorming | Question-based | Data and chart-based |
| Team size | Group work | Individual or small team | Data analyst or team |
| Needs data? | Not required | Not required | Required |
| Speed | Medium | Fast | Medium |
| Output | List of possible causes | One clear root cause path | Ranked list of top issues |
| Difficulty | Easy | Very easy | Easy to medium |
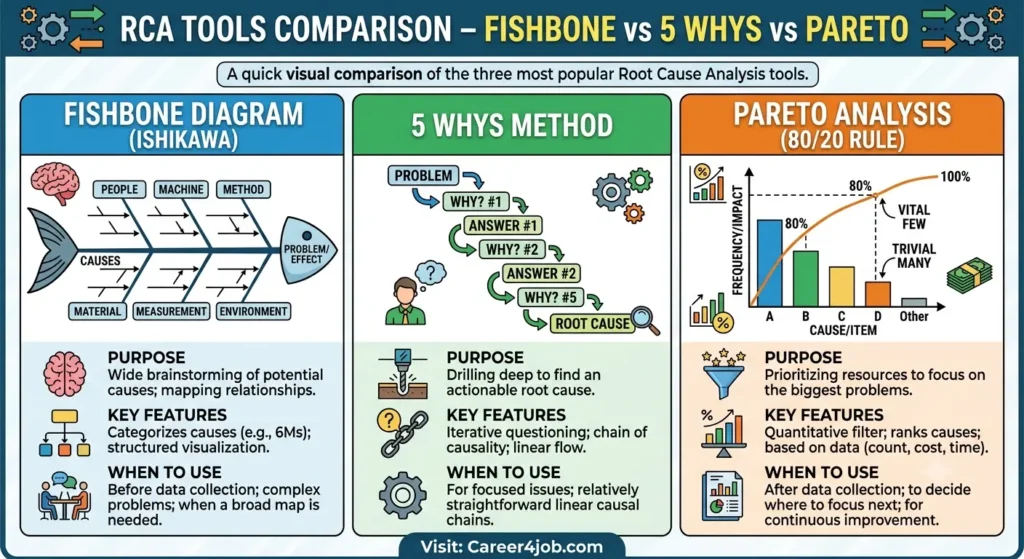
Step-by-Step Comparison
| Step | Fishbone Diagram | 5 Whys | Pareto Analysis |
| 1 | Define the problem | Define the problem | Collect defect/problem data |
| 2 | Draw the spine and categories | Ask “Why?” | Count frequency of each issue |
| 3 | Brainstorm causes | Ask “Why?” again | Sort from highest to lowest |
| 4 | Group and review causes | Repeat until root cause found | Create bar chart |
| 5 | Verify with data | Create action plan | Focus on top 20% causes |
Which Technique Should You Choose?
Choosing the right tool depends on your problem type. Here is a simple guide:
- Use Fishbone Diagram when the problem has many possible causes and you need team input.
- Use 5 Whys when the problem seems simple and you want a fast answer.
- Use Pareto Analysis when you have many problems and need to know which one to fix first.
| Pro Tip: These tools work even better together. Use Pareto Analysis to find the biggest problem, Fishbone Diagram to list possible causes, and 5 Whys to confirm the true root cause. |
Real-Life Industry Example
Industry: Automobile parts manufacturing
Problem: A high number of rejected parts during quality inspection.
Step 1 – Pareto Analysis
The team collected defect data for one month. They found that surface scratches made up 45% of all defects, the highest of any category.
Step 2 – Fishbone Diagram
The team held a brainstorming session and grouped possible causes: Man, Machine, Method, Material, Measurement, Environment. They found several possible causes, including worn-out machine tools and poor handling during transport.
Step 3 – 5 Whys
The team picked the most likely cause and asked “why” repeatedly:
- Why are there scratches? → Parts rub against each other during transport.
- Why do they rub together? → The storage trays have no dividers.
- Why do trays have no dividers? → Old tray design was never updated.
- Why was it never updated? → No one reviewed the packaging process in years.
- Why was it not reviewed? → No scheduled process review system existed.
Root Cause: No regular process review system for packaging.
Result: The team introduced divided trays and a yearly process review. Defects dropped by 60% within two months.
This example shows how combining all three tools gives stronger, more reliable results than using just one.
Common Mistakes to Avoid
Avoid these common errors when doing Root Cause Analysis:
- Stopping too early – Finding a surface cause and stopping before reaching the real root.
- Blaming people – RCA should focus on systems and processes, not individuals.
- Skipping data verification – Guessing instead of checking facts.
- Doing RCA alone – Missing the input of people who understand the process.
- Using only one tool – Some problems need more than one technique.
- Not documenting findings – Losing valuable information for future reference.
- Ignoring small problems – Small issues can grow into big ones over time.
Best Practices
Follow these best practices for accurate and useful RCA:
- Involve the right people – Include those who work closely with the process.
- Use real data, not assumptions.
- Keep an open mind – Do not decide the cause before investigating.
- Document every step for future learning.
- Set clear action plans after finding the root cause.
- Follow up to confirm the fix works over time.
- Combine tools when the problem is complex.
- Review regularly – Make RCA part of your continuous improvement process.
According to the International Organization for Standardization (ISO), structured problem-solving methods like RCA support quality management systems such as ISO 9001 (source: iso.org).
Frequently Asked Questions (FAQs)
What is Root Cause Analysis in simple words?
Root Cause Analysis is a way to find the real reason a problem happens, instead of just fixing the surface issue.
What are the 3 main RCA tools?
The three most common tools are Fishbone Diagram, 5 Whys Method, and Pareto Analysis.
Who created the Fishbone Diagram?
Dr. Kaoru Ishikawa, a Japanese quality expert, created it in the 1960s.
Why is it called a Fishbone Diagram?
Because its shape looks like the skeleton of a fish, with the problem at the head and causes as bones.
How many times should you ask “why” in the 5 Whys method?
Usually five times, but you can ask more or fewer depending on the problem.
What is the 80/20 rule in Pareto Analysis?
It means about 80% of problems come from 20% of causes.
Can I use more than one RCA tool for the same problem?
Yes. Many teams combine Pareto, Fishbone, and 5 Whys for stronger results.
Is Root Cause Analysis only used in factories?
No. It is used in healthcare, IT, customer service, and many other industries.
What is the difference between a symptom and a root cause?
A symptom is the visible effect of a problem. A root cause is the true reason behind it.
Do I need software to do RCA?
No. You can do RCA with pen and paper, or simple spreadsheet tools.
Is 5 Whys good for complex problems?
Not always. It works best for simple problems with one clear cause path. Complex problems often need Fishbone Diagram too.
What is the main goal of Root Cause Analysis?
The main goal is to prevent problems from happening again by fixing the true cause.
How does RCA help businesses save money?
By stopping repeated failures, RCA reduces repair costs, downtime, and waste.
How does RCA help businesses save money?
By stopping repeated failures, RCA reduces repair costs, downtime, and waste.
What industries use Pareto Analysis the most?
Manufacturing, quality control, healthcare, and customer service teams use it often to prioritize issues.
Can beginners learn these RCA tools easily?
Yes. All three tools are simple to learn and do not require special training to get started.
Final Thoughts
Root Cause Analysis is one of the most useful skills you can learn in quality management and problem-solving. It helps you stop fixing symptoms and start fixing real problems.
The Fishbone Diagram helps you brainstorm all possible causes. The 5 Whys Method helps you dig deep with simple questions. Pareto Analysis helps you focus on the biggest problems first.
You do not need to be an expert to start. Pick a small problem today, choose one of these tools, and try it. With practice, root cause analysis will become a natural part of how you solve problems.
| Remember: A problem well understood is a problem half solved. Take time to find the real root cause, and lasting solutions will follow. |
References
- ASQ – Root Cause Analysis
- ASQ – Fishbone (Ishikawa) Diagram
- Lean Enterprise Institute
- ISO – Quality Management
- NIST – Quality and Process Improvement Resources
Related Articles
Continuous Improvement (Kaizen) Explained
What is Six Sigma? A Beginner’s Guide
7 Basic Quality Tools Every Professional Should Know
How to Reduce Manufacturing Defects
AI in Cleaning Validation: The Future of Pharmaceutical Manufacturing